St. Matthew Island. On reindeer and lichen

Today is all about reindeer. I stumbled upon this comic the other day and was delighted. I had seen it some time ago and thought it to be very neatly relevant to system dynamics. And had lost the link. Anyway, here is the link, go read it or the rest will make no damn sense.

Done?

OK, I’ll give you a minute.

Done? Good.

My interest in this is twofold. Firstly, this comic is a direct reflection of what World Dynamics is all about and secondly I’d very much like to put some numbers behind the story and the ecosystem structure should be for something like this to happen. Typically a case like this is used to illustrate a point of over-compensation: herd growth does not stop when the food runs out (as there are a number of calves underway) so the population grows beyond what the ecosystem can sustain.

I built a model. Actually I built several. And I did not get the behavior depicted in the diagram. The thing is that there are no right angles in nature. All the reindeer just didn’t eat happily to their hearts content one day and were utterly out of food the next. Also, lichen reproduces so slowly that we can assume the island can not sustain a single reindeer on just lichen growth alone. Therefore, lichen will run totally out at some point regardless of how the herd behaves (the consumption exceeds growth) and therefore the overcompensation concept does not apply: the model starts off in a point where it is already beyond the limit.

I inevitably ended up with a nice bell curve: the population grows to a point where the lichen starts having an effect on both fertility and longevity and its a nice steady decline to zero from there. as the food gets gradually scarcer. The important conclusion is that the result is symmetrical: exponential growth is followed by exponential decline.

Here’s the thing. Maybe what the people saw was _not_ the peak but rather the decline? If we assume that the island at some point had not 6 bot about 12 thousand reindeer, we can easily find a normal distribution curve that very closely fits the observation points. Which, of course, means that there was no dramatic cliff the population stumbled over. Don’t get me wrong, halving the population in a couple of years is dramatic as well but the diagram in the cartoon seems off. I’ll ponder over it for a while and see if I come up with an alternative solution but that’s that for the moment

Oh, and a notice: the next two weeks are going to be the peak of my thesis-writing so I might not get around to come up with stuff to post here – it takes considerable time and while superinteresting, I need to get the thesis done. Whatever I do, you should be enjoying system dynamics in action!

Tagged , , , ,

The beer game

As you might have noticed (maybe not), the usual programming was suspended on Friday. The reason for this is simple, I was playing the Beer Game.

No, this was absolutely nothing like you thought right now. It was a sober educational foray into the wonderful world of supply chains and system dynamics. The idea is that the players are made to play roles in a rather poorly designed supply chain where they have to sell, stock and produce beer. None of the players knows anything about what their neighbors do and the input variable (i.e. demand) is unknown as well. Communication is not permitted, you just draw conclusions from what’s happening. And boy, is that interesting.

Let me recount the layers of awesomness encountered.

Firstly, professor Morrison and his manner of delivering the subject. And, no, this is not me sucking up, I passed the class last year. The jokes, the attention to detail. Cool.

Secondly, the way you can feel yourself slowly drift away from reason as you try to understand what the hell is going on. You attempting to react to what is happening makes others react to _your_ actions which makes the input to you even more erratic and so forth. It gets ugly pretty fast.

Thirdly, the sheer predictability of human behavior. MIT folks have played the game for 50 or so years and kept meticulous records. Apparently, the results do not depend on whether the players are 5 or 55 years old, from kindergarten or upper management. Both the behavior of the game variables and the people is very similar. Except kids apparently tend to have fun.

Then there is the astonishing speed at which reasonable people resort to the fundamental attribution error. It was pretty civilized for us but some of the stories the prof told…

The applicability of it all. In a nutshell, we were presented with a small-world model of what we see every day. Do we realize it or not, we are part of complex systems all the time. We have no idea what is actually going on, we try to react the best we can and resort to the tools we have been taught regardless of their applicability or usefulness. We play the beer game every day.

Finally there is the learning. I was in a team that either had played the game before or had read about it. So we were somewhat prepared. Well, no. We did poorly. The entire group did worse than the 50-year average and we were on a third place within that below-average group of four teams. Doh. As a reflection, in my case it was mainly because I went back to one particular learning from one particular assignment from last year and tried to apply that with considerable lack of success. The topic is complex, I need to look at my notes and lecture materials and read more. Otherwise I have no place blogging about this thing, right?

Anyway, I do intend to get back with some more system dynamics on Friday. Until then, enjoy System Dynamics in action as much as I have done!

Tagged ,

On traffic

Oh dear, some horrible things happened around here with the gunman in the movies. For a second there I thought hey, this is a simple feedback loop between guns in the hands of criminals and guns in the hands of citizens, let’s make a post. Then I realized the magnitude of wrongness of me doing that. I also realized that the system is actually not that simple at all. Thus, we will continue with our regular programming delayed by a technical glitch and come back to the guns thing at a later time if at all.


Today we talk about traffic. Not least because this week professor Jay Forrester gave his lecture to the System Dynamics class. He is, of course, the grand old man of urban studies and last year at the same class he said something really interesting (am quoting from memory) about the topic: “Whenever you decide to make something better, you are just pushing bottlenecks around. You need to decide, what you are willing to make _worse_ in order to achieve a lasting result”

I have lately made the mistake of following up on Estonian media and, based on the coverage, one of the most pressing issues there is that the city of Tallinn has overnight and without much warning halved the throughput of certain key streets.

While we speak, the Euro is falling, US is in the middle of a presidential debate, the Arab world is in flames, we are on a verge of a paradigm shift in science, Japan is making a huge change in their energy policy possibly triggering a global shift and all of this is surrounded by general climate change and running out of oil business.

Oh, well. We probably all deserve our parents, children, rulers and journalists.

Anyway, that piece of news seemed to match perfectly the words of Jay Forrester and thus todays topic.

What the quote above means is that tweaking system values will just prompt more tweaking. Making a road wider will encourage more people to drive on it necessitating expansion of source and sink roads which have source and sink roads of their own. Thus, what professor Forrester says is that in order for that cycle to stop, one must make a conscious decision _not_ to improve certain things. Yes, traffic is horrible but instead of adding more roads, what else can we do? How can we change the structure of the system rather than tweaking and re-tweaking certain values that will only result our target variable stabilize at a (hopefully more beneficial) level?

This brings us back to Tallinn. From one hand it might seem that the change is in the right direction: somebody has decided to make the lives of drivers worse in order to stop pushing the bottlenecks around.

Applause!

Or maybe not. You see, what Jay Forrester definitely did not mean was that _any_ action resulting in somebody being worse off is beneficial for the system. Only careful analysis can reveal what change can overcome the policy resistance of a given system.

The following is based on public statements about the future of public transport in Tallinn as reflected by media. It would certainly be better to base them on some strategy or vision document but alas, there is none. At least to my knowledge and not in public domain. There was a draft available on the internet for comments last summer but that’s it.

Uhoh.

Let’s see, then. When driving restrictions are applied, two things happen. Firstly, amount of people driving will go down simply because it is inconvenient but also, the _desire_ to go downtown will diminish after a while. I’ll go to the local shop instead of driving. Let’s lease our new office space somewhere with good access rather than downtown. That sort of thing. When willingness to drive downtown diminishes, amount of people driving certainly goes down but so will the number of people taking the bus: if the need and desire are gone, there is no point in standing in the bus stop, is there?

It has been publicly stated that the money acquired from making the lives of drivers harder (this includes high parking fees, among other things) will be used to fund adding capacity to public transport. Therefore, the less people drive, the less money there is to maintain some headroom in terms of capacity. The less headroom we have the higher the chance that the person taking the bus does not want to repeat the experience and prefers not to the next time. And, of course, investment in the road network drives up the amount of people who actually drive.

Simple, isn’t it? Before I forget, many of these causal relationships have delays. Offices do not get moved and shops built overnight, investments take time to show results. It takes time for people to realize they don’t actually want to spend 2 hours each day in traffic.

Here’s a diagram of the system I described.

Now, tell me, what changes in what variables and when will result in sudden and rapid increase in driving restrictions that occur simultaneously to a massive investment to road infrastructure at city boundary?

Nope, I have no idea either. From the structural standpoint, the system is a reinforcing loop surrounded by numerous balancing loops. Since several of them involve delays, it is very hard to tell whether the system would stabilize and when. It seems though that in any case, a reinforcing loop driving down the willingness of people to go downtown gets triggered. The danger with these things is, of course, that when they _don’t_ stabilize or stabilize at a lower level than desired, downtown will be deserted and left only to tourists (if any) as the need to go there diminishes. The citizens not being in downtown kind of defies the point of making that downtown a more pleasurable place, doesn’t it?

Surprisingly, the city of Tallinn has actually done some things to break the loops described. For example, the public transport system has operated on non-economic principles for years and years. The city just pays for any losses and there is no incentive to make a profit. This makes the system simpler and removes a couple of fast-moving economic feedback loops. For this particular campaign, however, taxation on drivers was specifically announced as a funding source for public transportation without much further explanation.

The system is an interesting one and had I some numbers to go on, would be fun to simulate. But I think I have made my point here. Urban transportation is a problem of high dynamic complexity. When the system described above was to be cast into differential equations, there would unlikely to be an analytical solution. How many of you can more or less correctly guess a solution to a Nth order system of partial differential equation? Without actually having the equations in front of you? Do it numerically? Right.

It is thus imperative that decisions that could easily result in rather severe consequences to the city are based on some science or are at least synchronized amongst each other (did I mention it? There is a multi hundred million euro development project underway to radically increase the capacity of a certain traffic hotspot in Tallinn) using some sort of common roadmap.

I hope this excursion into local municipal politics still provided some thoughts on system dynamics in general and hope you’ll enjoy some of it in action over a safe weekend!

Tagged , , , ,

Sustainable quality improvement

Today we are going to talk about quality assurance. I’m going to typical processes of a software house as an example but the principle should be applicable in a wider context.

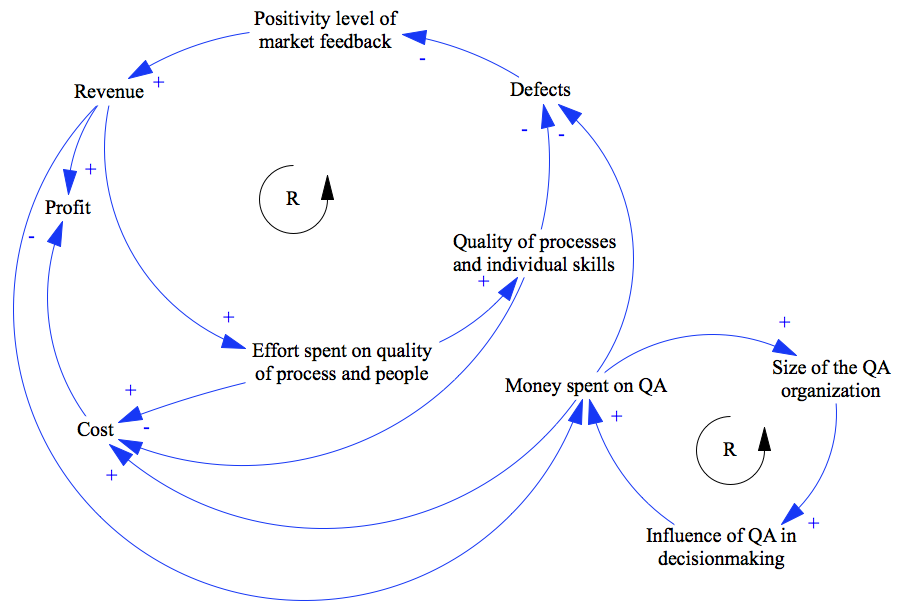
People make mistakes. Sometimes it is due to the way they work (the light switch and the drain-nuclear-reactor-coolant-system switch are identical and placed an inch appart) and sometimes is because they are just not well enough trained for the job. Sometimes they make mistakes because they are human but in any case, if the average quality of processes or people goes down, the number of defects in the product goes up. When the defects go up, the market is not going to like it and it will end up, in some way, driving down the revenue (Note: it might also be that the customer support costs or returns or whatever drive up the cost but the result is the same). This in turn drives down profit. When profit goes down, managers will be eager to find the culprit and might be inclined towards increasing investment in the QA. Effort spent on finding the defects before they reach the market goes up and the number of defects goes down again. This is what we’d call a balancing loop. Because it, well, balances itself.

What also happens as QA expense goes up, is that the average cost base of the company goes up which drives down profit which might lead to the same sort of managerial anger that caused QA expenditure to go up in the first place. Also, the more you spend on a unit the more powerful they get in the organization. The person commanding 200 people has more say in budget decisions than the person commanding 2. And of course they are going to as for more money. The entire picture looks like so:

There might be some process improvement going on but I think most QA folks agree that their primary job is catching bugs and finding better ways to do that. There is also a direct link between revenues and quality of people/processes as pointed out earlier but let’s ignore that added complexity for now.

I have two questions for you. With the forces at play, where do you think the quality level of the product stabilizes (if it indeed does stabilize)? And what do you think it takes in terms of money and effort to actually raise it to the next level?

You don’t know? Me neither. That’s the bloody thing: its a convoluted complex system where cause and effect go and dance tango leaving you to scratch your head in puzzlement. Oh, and did you notice? the thing that started at all does not feature in our primary feedback system at all. Nobody does anything to it and thus, whatever caused it to go down in the first place (loss of training budget due to missing of revenue targets?) is going to happen again and the entire system will tango to the sunset in search of a new equilibrium.

Let’s now say that instead of just kicking the arse of the head of QA (or increasing his budget), the management would go “Why?”. Why do our products have bugs? Why do we have more bugs today than we had yesterday? And increase the effort spent on process quality and people.

This picture is slightly better. The dance is still happening but at least the root causes are addressed and the entire system is likely to behave in a stable fashion after a while (even if this means oscillations).

Finally, let us take a long leap of faith and assume there is no managerial anger. That the leadership of the company has gone “Why the bloody hell are we constantly talking about quality? Why don’t we make it so that we don’t have to step in and manually govern the process? Let’s just make it simple and assign a fixed percentage of the revenue to process improvement”.

In this new reality, when the number of defects is pushed down (via a conscious push from QA, for example), the revenues go up, effort spent on process quality and training/hiring top people goes up which will, surprise, reduce the defects. What will also happen, is that the costs are actually going down. Smarter people working more smartly is a surefire way of reducing your development time and thus cost.

Whoa, hang on a minute. This thing does not stabilize! This thing is going to drive the defect rate down to a what exponentially approches zero!

Through a simple act of not caring the management has turned a balancing loop into a reinforcing loop. A loop that, once started, will drive down the defect rate to as close as zero as practically possible.

And this ladies and gentlemen, is why Toyota has become the worlds larges auto maker. This is why they have surpassed the Big Three in both quality and volume having started from the position of a clear underdog in both in just 40 years. Such learning-based feedback loops are a routine part of their production processes.

If this sounds similar then rejoice: agile software methods are to a large extent (to my surprise) rooted in the Toyota Production System. They preach the same concepts of fast reflection, constant improvement and built-in tests than Toyota does.

With this unexpected foray into the car industry, its time to end. Thank you for reading, have a good weekend and enjoy System Dynamics in action!

Tagged , , , , , ,

On mice and success

So this is it. After years of hard work, there is finally some success to speak of. That’s a good thing, right? Well, yes. And no.

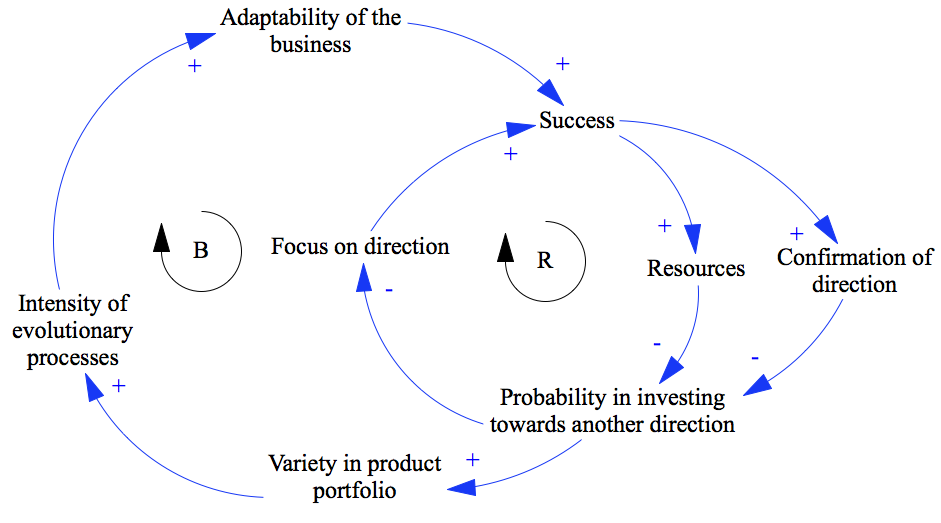
Let me elaborate. When you are successful, two things happen. The first is money. The more successful you are the more money there is. Actually, to be more generic, you get more “resources”. For an artist this might mean more freedom to do whatever they want, for a scientist this might mean recognition from peers and for a businessman this usually means money. The second thing that will happen that, all of a sudden, you are sure of your direction. Or more sure in any case. A startup is just a bunch of people with a crazy idea until the idea actually attracts users in the real marketplace. There is no way to be sure an idea will work until it has, well, actually worked.

You’ve got money, you’ve got a confirmation that your initial idea was good, what do you do? Let me tell you, based on personal experience, very few people go “Right, that’s that, then. I did this thing and it was good but now I’m going to take a risk by doing something completely different”. People will retire, oh yes, but majority of organizations and individuals tend to invest into the idea that brought them success. It makes sense, right? You’ve found a goose that lays golden eggs. Take the money from some of them eggs, hire a bunch of guys and go catch a herd of the suckers! You’ve got the recipe of a dish everybody likes, of course you are going to use their cheering as motivation to cook it again!

A well-funded and well-motivated individual focusing on doing something great they have already succeeded at once? Even if they were just lucky the first time around, chances of failure are slim under the circumstances. More success is unavoidable.

The entire model looks like so:

Success leads to money and confirmation which in turn drive down the likelihood of deviating from the set course which brings about focus and more success.

Brilliant, right? Kodak did this for 70+ years. Microsoft has been on this cycle for ages. IBM. GE.

No, not really. What this means is that the flexibility of an organization goes down. In the beginning, yes, its just the desire to choose a different path that goes away but soon the ability gets removed as well. After posting record profits for 10 consecutive quarters, your shareholders will not look kindly upon a CEO that proposes a radical change in direction. At some point an organization becomes so committed and invested in that one direction, even deliberation of change becomes hard. When everyone around is a chemist (or a software engineer, for that matter), who is there to experiment with hardware? Amazingly, Kodak actually managed to launch a digital imaging product as early as 1991 but the spectacular lack of success in the later years confirms the conclusion. The more successful you are the less likely you are to consider a change of direction.

Loss of flexibility is not a bad thing. Just like flying is not a bad thing. Its the hitting the earth part that gets you. When markets change and you don’t, things are not looking up.

Then there is the loss of variety.

Let’s think of Darwin, for a moment. He stipulated survival of the fittest. But what if everyone is equally fit? If you have a herd of mice, only the ones most successful in the given environment will survive and produce offspring. Should the conditions change, the definition of success changes, a different set of traits becomes desirable and the population survives. Given a bunch of genetically identical mice, however (let’s assume no random mutations), all the mice and their offspring are equal. If the environment is favorable, they’ll proliferate. But when the conditions change, they are doomed as there is no alternative set of traits to take over. There is none fitter to survive. The same goes with companies:

Single-mindedness in direction drives down variety in product portfolio (the “+”, as always, does not denote a positive influence but the fact that the variables move in the same direction). That reduces the intensity of evolutionary processes (our mice become more similar). This in turn reduces adaptability and eventually reduces chances of success.

What can we learn from this? Firstly, I think, it is not realistic to expect companies not to follow the cycle described earlier. People are not built that way. They will inevitably continue doing more of what makes them successful. Secondly, it seems that balancing the two cycles each other is a viable option. If the balancing loop kicks in when the success has already worn thin because of management failures or market issues, the company is done for. But if you manage to make sure both loops happen more or less simultaneously, survival is possible. Think of IBM. It was hit hard by changes in how computers are made but still had enough resources left to kick the cycle going backwards (lack of success reduces confirmation of direction which diversifies the portfolio) and to re-invent themselves. Few enough companies have pulled this off to call it a miracle of management.

Sidenote: there is interesting research on the topic of business survival. It seems that the pace of change is accelerating and companies die faster as they are no longer capable of adaptability the environment assumes. There is a good book about the topic as well.

Will your company be the next IBM or Kodak? Think about it while you enjoy System Dynamics in action!

Tagged , , , , , , ,

Trust issues

Today, let’s talk about trust.

One of the things that goes on in large organizations (yes, I’m building up to something) is these Systems. You know. Systems for Planning, Approval, Control And Reimbursement for Travel, Creation of Vendors, Buying Doughnuts, Going To Vacations, Politely Scratching Your Arse. You know. Yes, of course, when you have 3000 people operating in a complex legal environment, it makes sense to have a piece of software to track their vacation days. Of course it makes sense to have a place where these folks collectively clocking millions of air miles have a place to file their expenses. Sure. But this does not explain the sheer monstrosity and rigidity these Systems tend to develop to. Their sole purpose in the end seems to make the life harder for their users, not easier. How come?

One of strong reasons for this is trust.

Let’s take an example. At a hypothetical organization, there is a simple travel policy. When somebody needs to travel, they drop an e-mail to the travel assistant and cc their direct boss. The former organizes hotels, tickets and what not and the latter approves (denial is a huge exception) the trip. Simple, straightforward and flexible: everybody sees that a guy approaching 7 feet would need to fly business to US west coast and that you should stick around for at least a week while you are there. As the company grows, the system grows as well as two assistants can handle a sizable amount of travel requests and people don’t fly that often. Inevitably, however, there will be this one guy who discovers the pleasures of flying business and the sweet life of California. So he goes there often. Like on a monthly basis. From Europe. Whether he actually needs to or not is besides the point. The point is that the travel budget inevitably goes “clonk” and the person responsible for it goes “Yikes!”. As going “Yikes!” is an unpleasant experience and, after all, she is responsible for the budget. So a rule is established that business travel is only permissible for people at a certain pay grade and/or for durations of x hours and/or specifically approved by the boss.

These rules being in place, people go “Oh, these are the rules? I did not know it was actually OK to fly business!”. And they do because convincing your nice boss is not difficult. You know, there will be a meeting the day I land and I need to look the part. And I am a manager after all, it is allowed to fly business!

This, of course, leads to more budget being spent and more rules put in place. Which in turn leads to people discovering inventive ways to get around the restrictions. For example, it turns out, that if you wait until the very last minute to book your trip, often business class seats are all that are there and you absolutely need to make that meeting, don’t you?

In the end, the list of rules become too complex to follow by any single person and software is put in place. A System. In a short while, the travel costs soar, people swear and curse as it is impossible to plan travel the way they need to and somebody gets paid handsomely to maintain the entire machine.

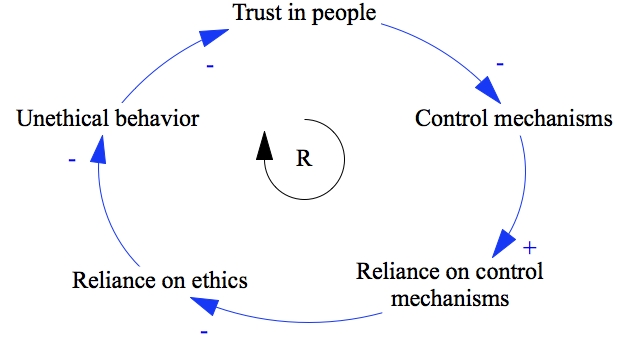
For the general case, the cycle looks like so:

Decline in trust in people leads to increase in control mechanisms (this is indicated by the “-” sign) which in turn lead to reliance in control mechanisms (“I’m good as long as I’m within the rules…”) which decreases reliance on simple ethics (“… regardless of whether it feels right or not”). The latter, of course, leads to increase unethical behavior that drives down trust in people.

In the end, a huge amount of trust is destroyed and good honest people are taught to weasel and scam. I don’t need to tell you what this does to the intellectual capital of the organization. In the organizational culture framework developed by Desmond Graves and Roger Harrison, this also means the organization drifts towards more centralization and more formalization. Regardless of whether this is a culture that supports the current strategy or not. Which is not good.

What can be done, then? Resist. The fact that somebody has a different understanding of the common value set should not mean that everybody needs to suffer. Just give the offending person a good round of managerial spanking to pull them back in line. Also, it helps to remind people of the shared values. Upon every opportunity. Really. Often. But not too often. The point is that it needs to be absolutely not OK for people to waste company resources. It must be an offense that leads to people not talking to you. Or talking to you about that it is not OK to do stuff you did. Loss of respect. That sort of thing. Simple managerial skill and talking to people goes a long way!

Hope this got you thinking about what goes on in your organization. Have a good weekend and enjoy System Dynamics in action!

Tagged , , , , , ,

Ahead of the pack

This week has been the first serious week of school (yay!) and thus this post and the future ones will be inspired by the topics that come up at lectures.

One of the coolest things I’ve discovered this week is this book. It discusses the interesting phenomenon that certain organizations, given the same commodities, seem to be able to gain significantly better performance than the others. Toyota uses the same steel and hires from the same communities than others and yet they are way more profitable and their quality is better. Intel uses the same silicone and brains and yet their chips are better. How come?

We are going to spend an entire term looking into this but it resonates strongly with some research I did a while ago on Estonian IT job market. What I found was that 10% of the organizations move 90% of the money and employ vast majority of the people. In a situation where even ten years ago all the companies had pretty much the same starting point, there were no clear winners or losers. I speculated on a potential reason that, I’ve found, the theory seems to support.

And here it comes:

It’s a really simple model. The more spare resources (money, expendable employee-hours, managerial time etc) an organization has, the higher its ability to invest into people – give them training, send them to conferences but also take time to hire and retain high-quality brains. Mind you, that’s an ability, not a direct correlation but at least there is a chance people get a training or have time to read a book. The more is invested into people, the more knowledgeable they are, obviously. The better the average quality of the employees, the better the overall efficiency of the organization: smarter people make less mistakes and have a higher productivity. And, of course, the better the employee efficiency the more spare resources the organization has.

Bear in mind that the cycle also works the other way around. The less resources you have (every waking hour is spent keeping the company afloat) the less you have to invest into people (you just hire the first person remotely capable of doing the job, pay them the least you can and have them work around the clock). The lower the productivity of the team and the less resources you have…

So could it be, that in Estonia, there are two kinds of IT companies? Ones for whom the cycle goes in one direction and those for whom it goes in the other? It seems plausible. What is curious is that it does not take that much. Ten years ago a modest difference in managerial skill could have positioned one company slightly above the line making some resources available and another one slightly below the line. But ten years later, given the relative stability of leadership, one cycle has made one organization dominate the market and has had the other one either sink in oblivion or barely be able to make the ends meet.

The sad part is that it is very hard to make the cycle go the other way around once it has wound itself down. You’d need a lot of managerial skill, you’d need a lot of dedicated work and you’d need a lot of money to invest to make the spare resources available. Why would anyone do this when they can spend the same money to hire more people to a functional company on a positive cycle?

The reason this model is interesting is that it explains some effects that are pretty unpleasant for the entire society. Firstly, in a small economy and in a small market like Estonia, the 10% can only be one or two companies. Which effectively creates a monopoly and that is not good. Secondly, whom do the companies in the 90% hire? The people willing to work long hours for a relatively low salary? The students. The statistics shows that effectively none of them graduate. None. You can draw your own model of how this affectes the sustainability of the academic system and how much public money is wasted on an unfinished education.

There you go. A hypothesis on Estonian IT market in-directly supported by actual research from auto industry. Although its just a theory, its applicability and consequences might be worth your thought.

See you next week and enjoy System Dynamics in action!

Tagged , , , ,

On changes

H’llo, here we go again!

Last time I promised I’d have some neat numbers for you but first, let’s talk about changes. Not like changing your hair color or favorite brand of root beer but changes in projects. Everybody knows they can be dangerous and implementing a proper change management procedure is one of the first things project managers are taught. And yet, change management can be a downfall of even the most well-managed projects. For instance, the Ingalls shipbuilding case I have referred to earlier.

Footnote: My favorite case ever on project management is also about changes. The Vasa was to be the pride of the Swedish navy in 1628 but sank on its maiden voyage in front of thousands of spectators. The reason? The king demanded addition of another gun deck dangerously altering the center of gravity of the ship. The jest of the story? The ship contained wooden statues of the project managers and those are now on display in the Vasa Museum in Stockholm. Get change management wrong and chances are 400 years later people will laugh and point fingers at your face.

Why is this? Mainly because of the difficulties of assessing impact. While direct costs involved in ripping out work already done and adding more work can be estimated with relative ease, the secondary effects are hard to estimate. Are we sure ripping out stuff wont’ disturb anything else? How many mistakes are we going to make while doing the additional work, how many mistakes will slip through tests and how many mistakes will the fixes contain? As the case referred to earlier illustrates, this is a non-trivial question.

“Yes”, you say, ” this is why good project managers add a wee bit of buffer and it is going to be fine in the end”. Really? How much buffer should you add, pray? Simulation to the rescue!

What I did was to add 10 tasks worth of work to a project of 100 tasks. 10% growth. I did this in a couple of ways. Firstly, I made the new stuff appear over 10 days early in the project, then the same late in the project and then added 10 tasks as a constant trickle spread over the entire project. Here are the results:

What’s that butt-ugly red thing, you ask? Oh, that’s something special we already had a brush with an an earlier post. You see, sometimes projects are set up so that the customer does not accept or test anything before there is something to really show off and that is late in the project. Of course, this means that the customer can not come up with any changes before that delivery happens and of course no mistakes are discovered either. The thing I like most about the red bar is how the amount of work to be done doubles after the testing starts. For the project manager this means that there is no way to even assess the quality of their work and thus there is no way to tell, if you are meeting the schedule and budget or not and the actual project duration is FOUR TIMES longer than projected based on initial progress…

I realize the graph is a bit of a mess so here’s a helpful table:

Tasks done Percentage added to base Multiplier to work added
Base case 336.42 0.00% 0.00
New work added early 357.89 6.38% 2.15
New work added late 369.82 9.93% 3.34
Late acceptance 429.077 27.54% 9.27
Trickle 361.369 7.42% 2.49

I chose not to review the deadlines as we are trying to asses the cost and not deadline impact of a change. The amount of work actually done is much more telling.

The first column shows the number of tasks actually done at the end of the project. For base case (the productivity and failure parameters are similar to the ones used in the previous post), this is 336.42. This should not come as a surprise to you, dear reader, but stop for a moment to digest this. In an almost ideal case the project takes 3.36 times more effort than would be expected.

The second column shows how many percentages the scenario adds to the tasks done in base case and the third one shows by how much these ten additional tasks got multiplied in the end.

Not very surprisingly, the best case scenario is to get the changes done with early on in the project. This is often not feasible as the customer simply will not know what the hell they want and so, realistically, trickle is the practical choice. By the way, this is where agile projects save tons of effort. Adding new work late is much worse, 10 new tasks become 33.4.

Now, close your eyes and imagine explaining your customer that a change that adds $1000 worth of effort to the project should be billed as $3340.

Done? At what price did you settle? Well, every dollar lost represents a direct loss to your company as the costs will be incurred regardless of whether or not the customer believes in this or not. To put this into perspective, 11.93 tasks worth of work can be saved if the customer comes up with a change earlier. Esteemed customer, this is the cost of you not telling the contractor about changing your mind early enough.

By far the worst case is the late testing. The effort goes up by almost an order of magnitude! That’s really not cool. Who does that sort of thing, anyway? Come to think of it, anybody who does classical one-stage waterfall which is an alarming percentage of large government contracts and a lot of EU-funded stuff. Scary. Nobody wins, you see. Even if the contractor, through some miracle of salesmanship combined with accounting magic, manages to hide the huge additional cost somewhere in the budget, they are unlikely to be able to hide the cost and the margin so the contractors overall margin on the project goes way down while the costs for the customer go up. They could choose to change the process instead and split the 2/3 of the savings between themselves… Wouldn’t it be lovely?

Let’s hang on to that thought until next week. Meanwhile, do observer System Dynamics in Action!

Tagged , , ,

Brook’s law: revisited

Ha. I went and read the Mythical Man Month again. Found the spot where he speaks about the effect of adding more people. Then I went and read comments from you guys and thought.

The result is that, indeed, if I dial the effects really high, the project indeed moves slower than it was before. For a while. The critical effects I found were:

  • Productivity drop. The rest of the team needs to effectively to focus on teaching the newcomers
  • Hiring speed. The speed at which the new people come on board has an interestingly strong effect. When the new people get added gradually, the resulting impact is way smaller
  • Error rate. The rookies need to make a ton of mistakes for the result to show

Actually, this is pretty much exactly what Brook says. And actually my model behaves exactly like Brooke says, too. You see, he talks about a late project. A project that is either close to or having already passed a deadline. And if you add so late in the project that it ends before they learn the ropes and the productivity gains show, he is right. In the long run, though, adding more people will work out.

What a relief! Both me and mr. Brook were right! Not that the latter would come as a surprise, though.

Oh, and I have already some tasty numbers for this weeks episode, so stay tuned and observe SD in action!

Tagged ,

Brook’s law

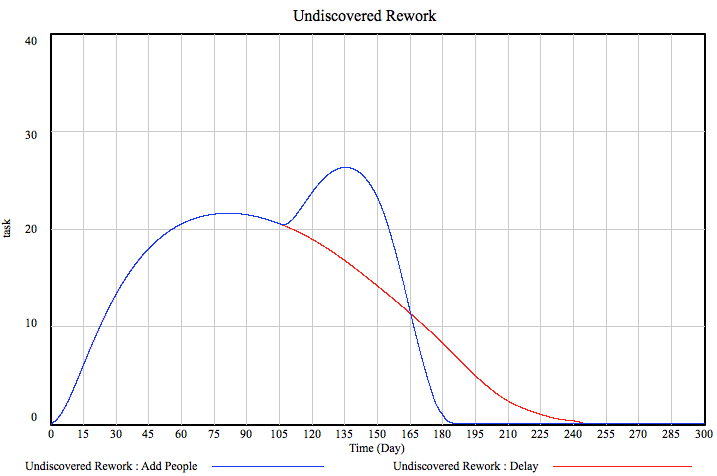
There really is no other way of saying this but I was wrong. I went into this being fully confident that it’d be simple to show how adding more people to a project can make it take longer (which is what Brook stated in his legendary Mythical Man Month). Well, in my model, it doesn’t. Whatever I do, I end up with a work-to-do graph that shows a minuscule blip above the normal behavior when people are added and then a rapid decline to a much faster project end. Mind you, doubling the team size still does not halve the project duration but still. What I get is something like this:

People, obviously, are added at week 105. By varying the number of people added, the the effect they have on productivity and the way they change the error rate, I can change the shape of the curve but it inevitably crosses the blue line (the scenario without people being added) at about the same point.

Well, whaddayaknow. I will be travelling this weekend and settling in next week so am not sure if I’ll get to that but I’d really like to find out what the hell happened. I’ll read The Mythical Man-month again. I’ll look at the model and play around with it. It might be that I neglected some important point Brook is making like add-more-people-productivity-drops-add-even-more-people feedback loops (although based on current results there is too little of effect to trigger that). It might be that I’m just interpreting the output incorrectly or that there’s a bug in the model. In any case, I’m baffled. Which means I’m learning. Which hopefully meant you are learning as well.

Talk to you next week! Take care and enjoy System Dynamics in Action!

Tagged , ,