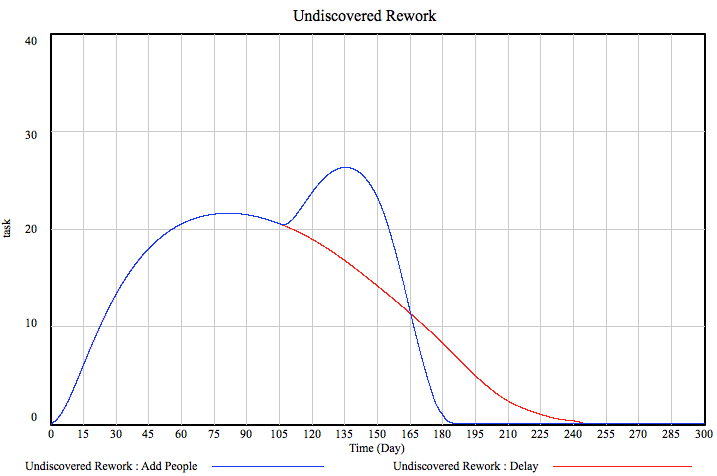
There really is no other way of saying this but I was wrong. I went into this being fully confident that it’d be simple to show how adding more people to a project can make it take longer (which is what Brook stated in his legendary Mythical Man Month). Well, in my model, it doesn’t. Whatever I do, I end up with a work-to-do graph that shows a minuscule blip above the normal behavior when people are added and then a rapid decline to a much faster project end. Mind you, doubling the team size still does not halve the project duration but still. What I get is something like this:
People, obviously, are added at week 105. By varying the number of people added, the the effect they have on productivity and the way they change the error rate, I can change the shape of the curve but it inevitably crosses the blue line (the scenario without people being added) at about the same point.
Well, whaddayaknow. I will be travelling this weekend and settling in next week so am not sure if I’ll get to that but I’d really like to find out what the hell happened. I’ll read The Mythical Man-month again. I’ll look at the model and play around with it. It might be that I neglected some important point Brook is making like add-more-people-productivity-drops-add-even-more-people feedback loops (although based on current results there is too little of effect to trigger that). It might be that I’m just interpreting the output incorrectly or that there’s a bug in the model. In any case, I’m baffled. Which means I’m learning. Which hopefully meant you are learning as well.
Talk to you next week! Take care and enjoy System Dynamics in Action!
