Posted in June 2012

Trust issues

Today, let’s talk about trust.

One of the things that goes on in large organizations (yes, I’m building up to something) is these Systems. You know. Systems for Planning, Approval, Control And Reimbursement for Travel, Creation of Vendors, Buying Doughnuts, Going To Vacations, Politely Scratching Your Arse. You know. Yes, of course, when you have 3000 people operating in a complex legal environment, it makes sense to have a piece of software to track their vacation days. Of course it makes sense to have a place where these folks collectively clocking millions of air miles have a place to file their expenses. Sure. But this does not explain the sheer monstrosity and rigidity these Systems tend to develop to. Their sole purpose in the end seems to make the life harder for their users, not easier. How come?

One of strong reasons for this is trust.

Let’s take an example. At a hypothetical organization, there is a simple travel policy. When somebody needs to travel, they drop an e-mail to the travel assistant and cc their direct boss. The former organizes hotels, tickets and what not and the latter approves (denial is a huge exception) the trip. Simple, straightforward and flexible: everybody sees that a guy approaching 7 feet would need to fly business to US west coast and that you should stick around for at least a week while you are there. As the company grows, the system grows as well as two assistants can handle a sizable amount of travel requests and people don’t fly that often. Inevitably, however, there will be this one guy who discovers the pleasures of flying business and the sweet life of California. So he goes there often. Like on a monthly basis. From Europe. Whether he actually needs to or not is besides the point. The point is that the travel budget inevitably goes “clonk” and the person responsible for it goes “Yikes!”. As going “Yikes!” is an unpleasant experience and, after all, she is responsible for the budget. So a rule is established that business travel is only permissible for people at a certain pay grade and/or for durations of x hours and/or specifically approved by the boss.

These rules being in place, people go “Oh, these are the rules? I did not know it was actually OK to fly business!”. And they do because convincing your nice boss is not difficult. You know, there will be a meeting the day I land and I need to look the part. And I am a manager after all, it is allowed to fly business!

This, of course, leads to more budget being spent and more rules put in place. Which in turn leads to people discovering inventive ways to get around the restrictions. For example, it turns out, that if you wait until the very last minute to book your trip, often business class seats are all that are there and you absolutely need to make that meeting, don’t you?

In the end, the list of rules become too complex to follow by any single person and software is put in place. A System. In a short while, the travel costs soar, people swear and curse as it is impossible to plan travel the way they need to and somebody gets paid handsomely to maintain the entire machine.

For the general case, the cycle looks like so:
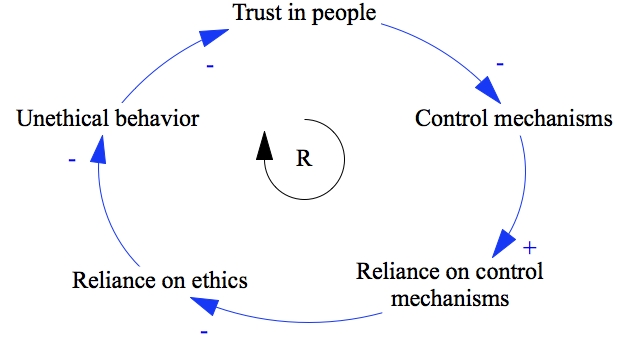
Decline in trust in people leads to increase in control mechanisms (this is indicated by the “-” sign) which in turn lead to reliance in control mechanisms (“I’m good as long as I’m within the rules…”) which decreases reliance on simple ethics (“… regardless of whether it feels right or not”). The latter, of course, leads to increase unethical behavior that drives down trust in people.

In the end, a huge amount of trust is destroyed and good honest people are taught to weasel and scam. I don’t need to tell you what this does to the intellectual capital of the organization. In the organizational culture framework developed by Desmond Graves and Roger Harrison, this also means the organization drifts towards more centralization and more formalization. Regardless of whether this is a culture that supports the current strategy or not. Which is not good.

What can be done, then? Resist. The fact that somebody has a different understanding of the common value set should not mean that everybody needs to suffer. Just give the offending person a good round of managerial spanking to pull them back in line. Also, it helps to remind people of the shared values. Upon every opportunity. Really. Often. But not too often. The point is that it needs to be absolutely not OK for people to waste company resources. It must be an offense that leads to people not talking to you. Or talking to you about that it is not OK to do stuff you did. Loss of respect. That sort of thing. Simple managerial skill and talking to people goes a long way!

Hope this got you thinking about what goes on in your organization. Have a good weekend and enjoy System Dynamics in action!

Tagged , , , , , ,

Ahead of the pack

This week has been the first serious week of school (yay!) and thus this post and the future ones will be inspired by the topics that come up at lectures.

One of the coolest things I’ve discovered this week is this book. It discusses the interesting phenomenon that certain organizations, given the same commodities, seem to be able to gain significantly better performance than the others. Toyota uses the same steel and hires from the same communities than others and yet they are way more profitable and their quality is better. Intel uses the same silicone and brains and yet their chips are better. How come?

We are going to spend an entire term looking into this but it resonates strongly with some research I did a while ago on Estonian IT job market. What I found was that 10% of the organizations move 90% of the money and employ vast majority of the people. In a situation where even ten years ago all the companies had pretty much the same starting point, there were no clear winners or losers. I speculated on a potential reason that, I’ve found, the theory seems to support.

And here it comes:

It’s a really simple model. The more spare resources (money, expendable employee-hours, managerial time etc) an organization has, the higher its ability to invest into people – give them training, send them to conferences but also take time to hire and retain high-quality brains. Mind you, that’s an ability, not a direct correlation but at least there is a chance people get a training or have time to read a book. The more is invested into people, the more knowledgeable they are, obviously. The better the average quality of the employees, the better the overall efficiency of the organization: smarter people make less mistakes and have a higher productivity. And, of course, the better the employee efficiency the more spare resources the organization has.

Bear in mind that the cycle also works the other way around. The less resources you have (every waking hour is spent keeping the company afloat) the less you have to invest into people (you just hire the first person remotely capable of doing the job, pay them the least you can and have them work around the clock). The lower the productivity of the team and the less resources you have…

So could it be, that in Estonia, there are two kinds of IT companies? Ones for whom the cycle goes in one direction and those for whom it goes in the other? It seems plausible. What is curious is that it does not take that much. Ten years ago a modest difference in managerial skill could have positioned one company slightly above the line making some resources available and another one slightly below the line. But ten years later, given the relative stability of leadership, one cycle has made one organization dominate the market and has had the other one either sink in oblivion or barely be able to make the ends meet.

The sad part is that it is very hard to make the cycle go the other way around once it has wound itself down. You’d need a lot of managerial skill, you’d need a lot of dedicated work and you’d need a lot of money to invest to make the spare resources available. Why would anyone do this when they can spend the same money to hire more people to a functional company on a positive cycle?

The reason this model is interesting is that it explains some effects that are pretty unpleasant for the entire society. Firstly, in a small economy and in a small market like Estonia, the 10% can only be one or two companies. Which effectively creates a monopoly and that is not good. Secondly, whom do the companies in the 90% hire? The people willing to work long hours for a relatively low salary? The students. The statistics shows that effectively none of them graduate. None. You can draw your own model of how this affectes the sustainability of the academic system and how much public money is wasted on an unfinished education.

There you go. A hypothesis on Estonian IT market in-directly supported by actual research from auto industry. Although its just a theory, its applicability and consequences might be worth your thought.

See you next week and enjoy System Dynamics in action!
Tagged , , , ,

On changes

H’llo, here we go again!

Last time I promised I’d have some neat numbers for you but first, let’s talk about changes. Not like changing your hair color or favorite brand of root beer but changes in projects. Everybody knows they can be dangerous and implementing a proper change management procedure is one of the first things project managers are taught. And yet, change management can be a downfall of even the most well-managed projects. For instance, the Ingalls shipbuilding case I have referred to earlier.

Footnote: My favorite case ever on project management is also about changes. The Vasa was to be the pride of the Swedish navy in 1628 but sank on its maiden voyage in front of thousands of spectators. The reason? The king demanded addition of another gun deck dangerously altering the center of gravity of the ship. The jest of the story? The ship contained wooden statues of the project managers and those are now on display in the Vasa Museum in Stockholm. Get change management wrong and chances are 400 years later people will laugh and point fingers at your face.

Why is this? Mainly because of the difficulties of assessing impact. While direct costs involved in ripping out work already done and adding more work can be estimated with relative ease, the secondary effects are hard to estimate. Are we sure ripping out stuff wont’ disturb anything else? How many mistakes are we going to make while doing the additional work, how many mistakes will slip through tests and how many mistakes will the fixes contain? As the case referred to earlier illustrates, this is a non-trivial question.

“Yes”, you say, ” this is why good project managers add a wee bit of buffer and it is going to be fine in the end”. Really? How much buffer should you add, pray? Simulation to the rescue!

What I did was to add 10 tasks worth of work to a project of 100 tasks. 10% growth. I did this in a couple of ways. Firstly, I made the new stuff appear over 10 days early in the project, then the same late in the project and then added 10 tasks as a constant trickle spread over the entire project. Here are the results:

What’s that butt-ugly red thing, you ask? Oh, that’s something special we already had a brush with an an earlier post. You see, sometimes projects are set up so that the customer does not accept or test anything before there is something to really show off and that is late in the project. Of course, this means that the customer can not come up with any changes before that delivery happens and of course no mistakes are discovered either. The thing I like most about the red bar is how the amount of work to be done doubles after the testing starts. For the project manager this means that there is no way to even assess the quality of their work and thus there is no way to tell, if you are meeting the schedule and budget or not and the actual project duration is FOUR TIMES longer than projected based on initial progress…

I realize the graph is a bit of a mess so here’s a helpful table:

Tasks done Percentage added to base Multiplier to work added
Base case 336.42 0.00% 0.00
New work added early 357.89 6.38% 2.15
New work added late 369.82 9.93% 3.34
Late acceptance 429.077 27.54% 9.27
Trickle 361.369 7.42% 2.49

I chose not to review the deadlines as we are trying to asses the cost and not deadline impact of a change. The amount of work actually done is much more telling.

The first column shows the number of tasks actually done at the end of the project. For base case (the productivity and failure parameters are similar to the ones used in the previous post), this is 336.42. This should not come as a surprise to you, dear reader, but stop for a moment to digest this. In an almost ideal case the project takes 3.36 times more effort than would be expected.

The second column shows how many percentages the scenario adds to the tasks done in base case and the third one shows by how much these ten additional tasks got multiplied in the end.

Not very surprisingly, the best case scenario is to get the changes done with early on in the project. This is often not feasible as the customer simply will not know what the hell they want and so, realistically, trickle is the practical choice. By the way, this is where agile projects save tons of effort. Adding new work late is much worse, 10 new tasks become 33.4.

Now, close your eyes and imagine explaining your customer that a change that adds $1000 worth of effort to the project should be billed as $3340.

Done? At what price did you settle? Well, every dollar lost represents a direct loss to your company as the costs will be incurred regardless of whether or not the customer believes in this or not. To put this into perspective, 11.93 tasks worth of work can be saved if the customer comes up with a change earlier. Esteemed customer, this is the cost of you not telling the contractor about changing your mind early enough.

By far the worst case is the late testing. The effort goes up by almost an order of magnitude! That’s really not cool. Who does that sort of thing, anyway? Come to think of it, anybody who does classical one-stage waterfall which is an alarming percentage of large government contracts and a lot of EU-funded stuff. Scary. Nobody wins, you see. Even if the contractor, through some miracle of salesmanship combined with accounting magic, manages to hide the huge additional cost somewhere in the budget, they are unlikely to be able to hide the cost and the margin so the contractors overall margin on the project goes way down while the costs for the customer go up. They could choose to change the process instead and split the 2/3 of the savings between themselves… Wouldn’t it be lovely?

Let’s hang on to that thought until next week. Meanwhile, do observer System Dynamics in Action!

Tagged , , ,

Brook’s law: revisited

Ha. I went and read the Mythical Man Month again. Found the spot where he speaks about the effect of adding more people. Then I went and read comments from you guys and thought.

The result is that, indeed, if I dial the effects really high, the project indeed moves slower than it was before. For a while. The critical effects I found were:

  • Productivity drop. The rest of the team needs to effectively to focus on teaching the newcomers
  • Hiring speed. The speed at which the new people come on board has an interestingly strong effect. When the new people get added gradually, the resulting impact is way smaller
  • Error rate. The rookies need to make a ton of mistakes for the result to show

Actually, this is pretty much exactly what Brook says. And actually my model behaves exactly like Brooke says, too. You see, he talks about a late project. A project that is either close to or having already passed a deadline. And if you add so late in the project that it ends before they learn the ropes and the productivity gains show, he is right. In the long run, though, adding more people will work out.

What a relief! Both me and mr. Brook were right! Not that the latter would come as a surprise, though.

Oh, and I have already some tasty numbers for this weeks episode, so stay tuned and observe SD in action!

Tagged ,

Brook’s law

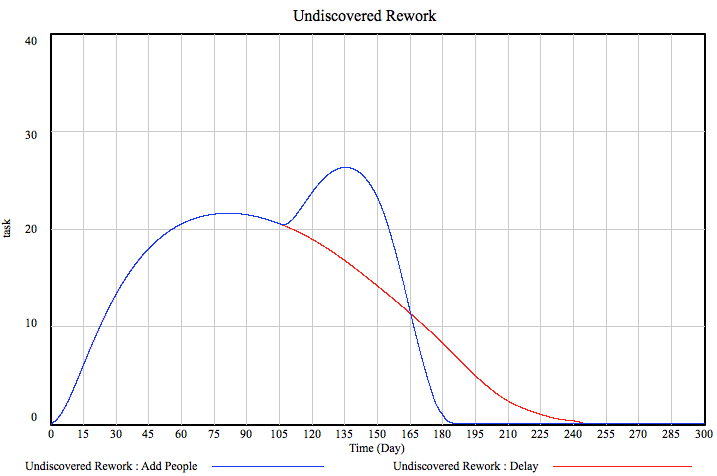
There really is no other way of saying this but I was wrong. I went into this being fully confident that it’d be simple to show how adding more people to a project can make it take longer (which is what Brook stated in his legendary Mythical Man Month). Well, in my model, it doesn’t. Whatever I do, I end up with a work-to-do graph that shows a minuscule blip above the normal behavior when people are added and then a rapid decline to a much faster project end. Mind you, doubling the team size still does not halve the project duration but still. What I get is something like this:

People, obviously, are added at week 105. By varying the number of people added, the the effect they have on productivity and the way they change the error rate, I can change the shape of the curve but it inevitably crosses the blue line (the scenario without people being added) at about the same point.

Well, whaddayaknow. I will be travelling this weekend and settling in next week so am not sure if I’ll get to that but I’d really like to find out what the hell happened. I’ll read The Mythical Man-month again. I’ll look at the model and play around with it. It might be that I neglected some important point Brook is making like add-more-people-productivity-drops-add-even-more-people feedback loops (although based on current results there is too little of effect to trigger that). It might be that I’m just interpreting the output incorrectly or that there’s a bug in the model. In any case, I’m baffled. Which means I’m learning. Which hopefully meant you are learning as well.

Talk to you next week! Take care and enjoy System Dynamics in Action!

Tagged , ,