H’llo, here we go again!
Last time I promised I’d have some neat numbers for you but first, let’s talk about changes. Not like changing your hair color or favorite brand of root beer but changes in projects. Everybody knows they can be dangerous and implementing a proper change management procedure is one of the first things project managers are taught. And yet, change management can be a downfall of even the most well-managed projects. For instance, the Ingalls shipbuilding case I have referred to earlier.
Footnote: My favorite case ever on project management is also about changes. The Vasa was to be the pride of the Swedish navy in 1628 but sank on its maiden voyage in front of thousands of spectators. The reason? The king demanded addition of another gun deck dangerously altering the center of gravity of the ship. The jest of the story? The ship contained wooden statues of the project managers and those are now on display in the Vasa Museum in Stockholm. Get change management wrong and chances are 400 years later people will laugh and point fingers at your face.
Why is this? Mainly because of the difficulties of assessing impact. While direct costs involved in ripping out work already done and adding more work can be estimated with relative ease, the secondary effects are hard to estimate. Are we sure ripping out stuff wont’ disturb anything else? How many mistakes are we going to make while doing the additional work, how many mistakes will slip through tests and how many mistakes will the fixes contain? As the case referred to earlier illustrates, this is a non-trivial question.
“Yes”, you say, ” this is why good project managers add a wee bit of buffer and it is going to be fine in the end”. Really? How much buffer should you add, pray? Simulation to the rescue!
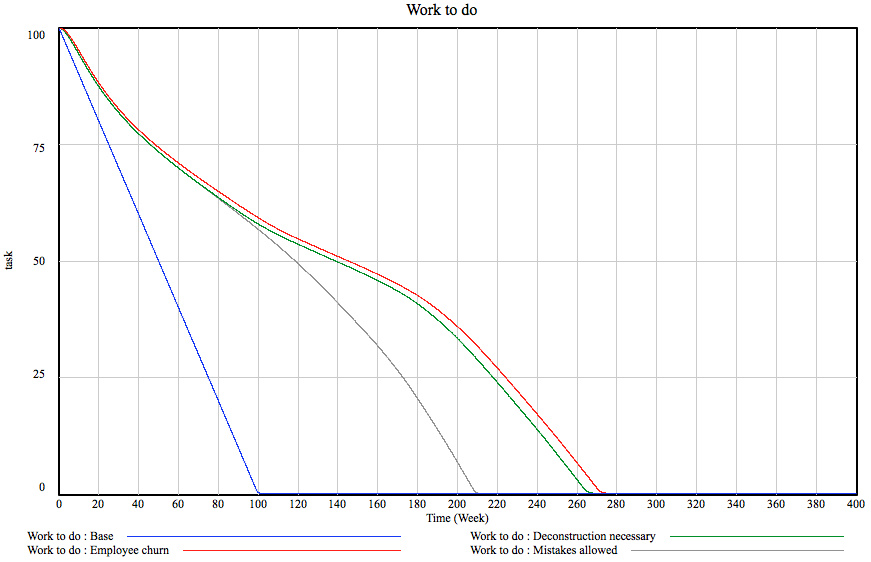
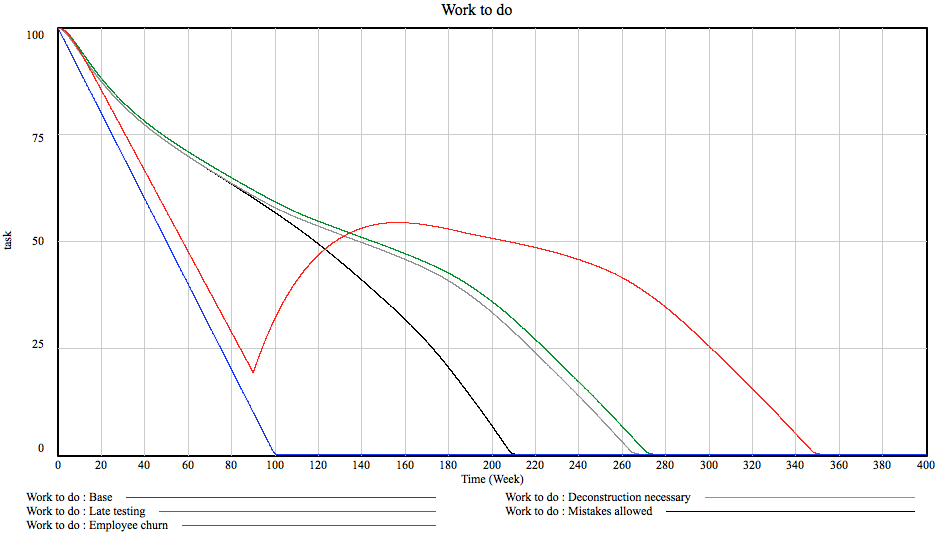
What I did was to add 10 tasks worth of work to a project of 100 tasks. 10% growth. I did this in a couple of ways. Firstly, I made the new stuff appear over 10 days early in the project, then the same late in the project and then added 10 tasks as a constant trickle spread over the entire project. Here are the results:
What’s that butt-ugly red thing, you ask? Oh, that’s something special we already had a brush with an an earlier post. You see, sometimes projects are set up so that the customer does not accept or test anything before there is something to really show off and that is late in the project. Of course, this means that the customer can not come up with any changes before that delivery happens and of course no mistakes are discovered either. The thing I like most about the red bar is how the amount of work to be done doubles after the testing starts. For the project manager this means that there is no way to even assess the quality of their work and thus there is no way to tell, if you are meeting the schedule and budget or not and the actual project duration is FOUR TIMES longer than projected based on initial progress…
I realize the graph is a bit of a mess so here’s a helpful table:
| Tasks done | Percentage added to base | Multiplier to work added | |
| Base case | 336.42 | 0.00% | 0.00 |
| New work added early | 357.89 | 6.38% | 2.15 |
| New work added late | 369.82 | 9.93% | 3.34 |
| Late acceptance | 429.077 | 27.54% | 9.27 |
| Trickle | 361.369 | 7.42% | 2.49 |
I chose not to review the deadlines as we are trying to asses the cost and not deadline impact of a change. The amount of work actually done is much more telling.
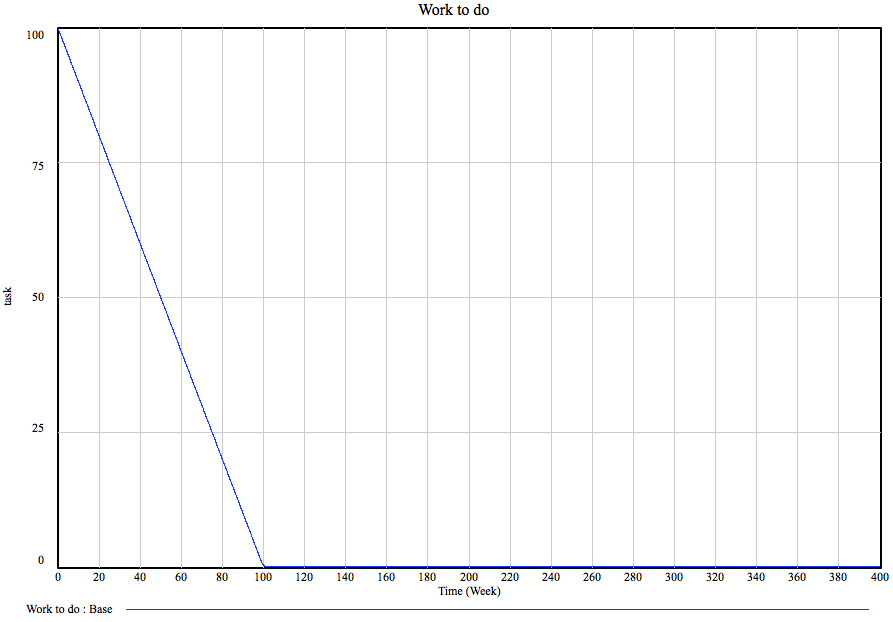
The first column shows the number of tasks actually done at the end of the project. For base case (the productivity and failure parameters are similar to the ones used in the previous post), this is 336.42. This should not come as a surprise to you, dear reader, but stop for a moment to digest this. In an almost ideal case the project takes 3.36 times more effort than would be expected.
The second column shows how many percentages the scenario adds to the tasks done in base case and the third one shows by how much these ten additional tasks got multiplied in the end.
Not very surprisingly, the best case scenario is to get the changes done with early on in the project. This is often not feasible as the customer simply will not know what the hell they want and so, realistically, trickle is the practical choice. By the way, this is where agile projects save tons of effort. Adding new work late is much worse, 10 new tasks become 33.4.
Now, close your eyes and imagine explaining your customer that a change that adds $1000 worth of effort to the project should be billed as $3340.
Done? At what price did you settle? Well, every dollar lost represents a direct loss to your company as the costs will be incurred regardless of whether or not the customer believes in this or not. To put this into perspective, 11.93 tasks worth of work can be saved if the customer comes up with a change earlier. Esteemed customer, this is the cost of you not telling the contractor about changing your mind early enough.
By far the worst case is the late testing. The effort goes up by almost an order of magnitude! That’s really not cool. Who does that sort of thing, anyway? Come to think of it, anybody who does classical one-stage waterfall which is an alarming percentage of large government contracts and a lot of EU-funded stuff. Scary. Nobody wins, you see. Even if the contractor, through some miracle of salesmanship combined with accounting magic, manages to hide the huge additional cost somewhere in the budget, they are unlikely to be able to hide the cost and the margin so the contractors overall margin on the project goes way down while the costs for the customer go up. They could choose to change the process instead and split the 2/3 of the savings between themselves… Wouldn’t it be lovely?
Let’s hang on to that thought until next week. Meanwhile, do observer System Dynamics in Action!


