It’s this time of the week again, time for another episode of (drumroll) SD Action!
Last time I introduced a basic project management model, this time let’s look at what this baby can do.
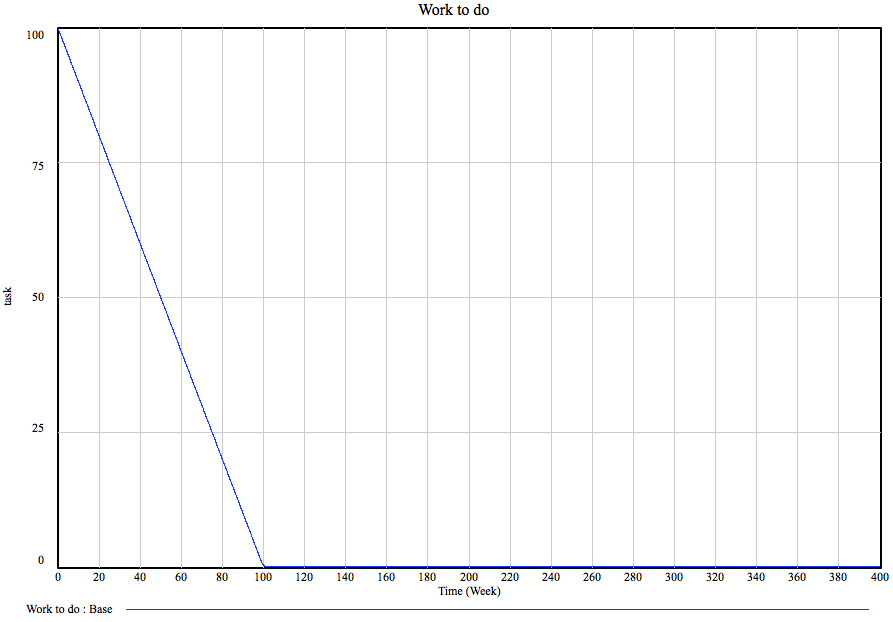
Let our base project be a project with 100 tasks. The team size is 200 people, each of whom can accomplish 0.005 tasks per week, this leads to… Oh, I don’t know. Here’s a graph:
Yup, the amount of work to be done (see the previous post for the model framework) goes down at a steady rate and the project is done by the one hundredth week. Nice. I can hear the more experienced project managers go “yeah, right!” Nothing ever goes as smoothly, people make mistakes! You’re supposed to add buffers and such, 30% is the standard practice.
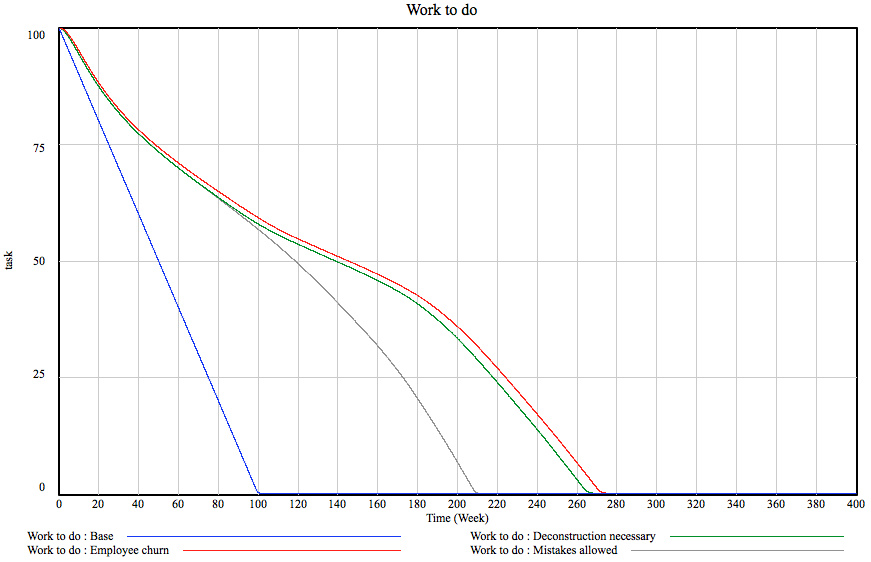
Hm, let’s see what happens if we allow people to make mistakes. On the model, this amounts to there being 20% of chance of a task to have the need to be re-done and the rework generation and discovery flows kicking in. Given the one fifth chance of a mistake, how much should we add to the project duration? 20%, right? Not exactly. You see, you might make mistakes on the bug fixes as well… You guessed it, here’s a graph:

What kind of sorcery is this? The project duration did not grow by 20% and not even 30%. It grew by 110%! Blimey, we just missed our deadline.
Oh well. Sure. Mistakes happen. But what if the mistakes are costly, generating more work to remove the previously done stuff? Remember the example of having to chip out old concrete before pouring new. Here we go:
Yes, this added another 55 weeks to the project. This is one year. By allowing mistakes to cause additional work. Of course, the relationships are more subtle but they are way too geeky to explain here. The deconstruction rate depends on how much of the project is done: it is 0 for about 50% and grows to 1 (in the later phase, as much of effort goes into deconstruction as into rework) as the project progresses. These assumptions are probably different in your field but in my world, one year got added to the project by making a fairly reasonable assumptions of mistakes costing effort.
As said earlier, the team size is 200 people. Given that at this point we are looking at a five-year project, it would be reasonable to assume that there is employee churn. Of course, the newcomers must learn the ropes before they can be productive and, in fact, the entire team starts out this way having about half the productivity. Let’s assume there is 10% employee churn annually, hiring is started immediately to replace the leavers (6 weeks to fill a position on average) and that it takes four weeks to get acquainted with the project.
This is actually not half bad, we loose only 5 weeks or so. It turns out that 10% churn in 200-person team is not a big deal. What is curious, though, that most of the lag is caused by the the fact that the team size actually goes down. How come? You see, given the parameters, the churn turns out to be faster than hiring. People leave until annual churn drops to the same level as hiring and stops there, the model stabilizes. In our case, this means there are 195 productive people, 3 people are constantly in incubation and 2 are just lost. This is where system dynamic modeling excels: solving this symbolically would have involved constructing and solving a system of differential equations but I just drew a couple of boxes and pressed a button.
How many of you have spotted a fatal flaw in the model? You did? Right! Give the gal a cookie!
Let’s give others a moment, shall we…
Yes, right. The thing is that the current model assumes testing starts immediately. The moment anybody writes a line of code or draws a line, it gets tested and, after a while, possible mistakes end up back at the work queue. Unfortunately, this is not how stuff happens in many cases.
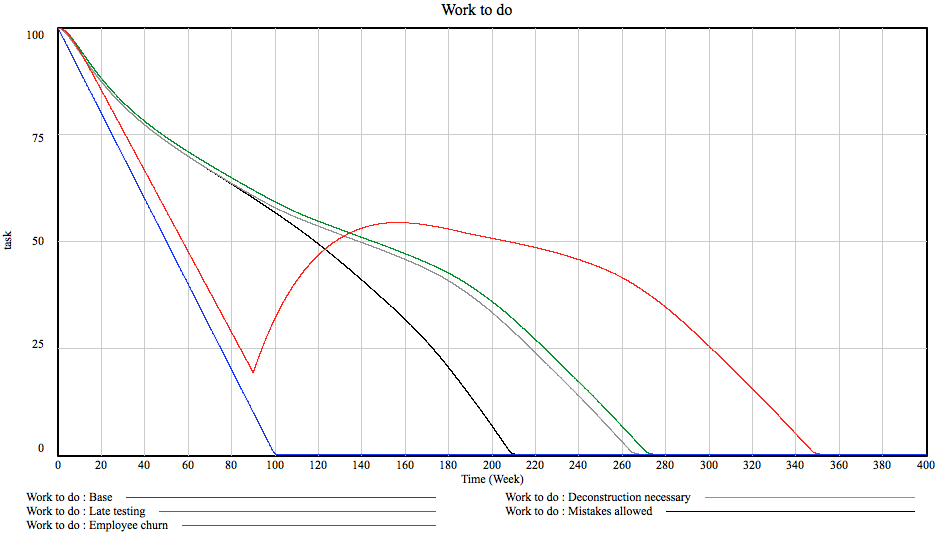
Let’s take construction. Firstly, the architect dreams up a house. Then a bunch of engineers figure out the structure of the thing. Then people come and work on pipes, ventilation and drains. And finally somebody devises a loom of electric wires. And then people go and start building it only to discover that a ventilation duct must pass directly through a structural beam. And a cable ladder crosses a flight of chairs. At about chest height. Bummer. With the way construction is done in this country, I’m assured, there are very little means to discover such mistakes before construction actually begins. In our model, I’ve made it so that there is no rework discovery until about a third through the project, then everything proceeds normally. This is how it goes:
Sweet mother of baby Jesus! 80 weeks! Of course I’m overdoing things a bit. Some testing does happen earlier. True. But the current model does not account for any customer spec changes or for any risk materializing so, broadly speaking, the order of magnitude – about 30% – should be in the ballpark. What is worth, though, is this:
The graph shows the ratio of percentage of work actually done and the percentage of work believed to be done. For all other cases, it peaks pretty early on and starts declining nicely but for late testing, it remains very high until very late. For a project manager this means that they have no idea whatsoever how the project is progressing. Which is a Bad Thing ™.
Let’s recap. By adding only four simple aspects of project behavior, our project has grown 350% in the worst case and about 250% for sensible testing behavior. And we still have not talked about risks or awkward acceptance tests or multiple contractors or, or… Oh God.
See, this is why projects are late. Project managers are faced with dynamically complex systems that can go off on wild tangents for any reason and usually only have their gut to rely on. Of course, being under deadline pressure and lacking concrete evidence they give in and promise these 100 weeks or possibly 150. Well, they should go and simulate their project model and see what comes out the other end. In short, they should observe System Dynamics in Action!


